Coverage
The Coverage page of the ONS web interface shows the calculated radio coverage of gateways on a map, along with the gateways themselves and, on request, the devices of selected applications. It shows which area the network covers by calculation and which gateways have not reported for a long time. Coverage is calculated by the external CloudRF service from the location, altitude and antenna of each gateway.
Gateways are grouped into coverage networks: the network is selected in the gateway card, in the Coverage field. One combined coverage image is calculated for each network, and this image is what the map shows.
What the coverage map shows
The page opens from the Coverage menu item, which sits between Billing and Gateways and is visible to every logged-in user. Networks and gateways load only if the user has the permission to view coverage networks; without it the map is empty. With it, the map shows coverage networks and their gateways in the visible area. The whole page is a single map.
| On the map | What it is |
|---|---|
| Coverage image | The calculated coverage of a whole network, semi-transparent (opacity 0.7) |
| Gateways | Circles; the color shows when the gateway last reported |
| Devices | Markers for the devices of selected applications; they appear only when requested |
| Path profile | A chart of the path between the selected gateway and a point on the map, built on request |
How the map loads data:
- Data is requested only for the visible area. On a pan or zoom the map immediately cancels any unfinished request and sends a new one once the map has been still for 1 second. While loading, the icon on the Refresh button spins.
- The server returns the coverage networks that have at least one gateway in the visible area that is neither deleted nor disabled. Networks come 50 per page, and the map reads only the first page, so one request brings at most 50 networks.
- A network that is already on the map is not updated by later requests: new data for it is discarded. Gateways of that network that were outside the visible area when it first loaded do not appear after you pan the map. Only networks not yet on the map are added. To load everything again, press Refresh.
- The map opens at zoom 12 (zoom levels 1–18 are available) centered on
43.24209, 76.87743. The browser remembers the last center, zoom and base layer (localStorage, keysrestoreCoordsandbaseLayer) and restores them on the next visit.
Layers and controls
The layer switcher has three base layers — Open Street Map, Google Map and Satellite — and two overlays: Coverage (the coverage images) and Node (the device markers). Gateway markers live in a separate layer that is not in the switcher, so gateways are always shown. The map also has a scale bar.
| Control | Where | What it does |
|---|---|---|
| Zoom buttons and distance ruler | Top right | Change the zoom; the ruler measures distance along a polyline on the map |
| Legend | Top right | A dBm scale: shades of green from −80 to −100 dBm in 5 dBm steps |
| Cubes icon (Show nodes) | Top right | Opens the device panel — see the "Devices on the map" section |
| Go-to form: Latitude, Longitude, Go, Clear | Top left | A click on the map fills the form with the coordinates of that point. Go puts a small red marker and a yellow circle with a radius of 2500 m at the point and moves the map there. Clear, the button with the recycle icon (its label shows on hover), removes these markers and the path-profile markers |
| Refresh | Top left | Rebuilds the map at the current center and zoom: drops the loaded networks and the selected gateway and loads the data again |
| Path Profile Analysis and the "Receiver height, m" field | Top left | Build a path profile — see the "Path profile analysis" section |
| Cursor coordinates | Bottom left | Show the coordinates of the point under the cursor as lat: … lng: … |
The legend is a fixed image. It is drawn for the LORA100.dBm color scheme, which is set in the default calculation parameters (the col parameter, see the "How coverage is built" section).
The base map in the screenshots on this page is © OpenStreetMap contributors.
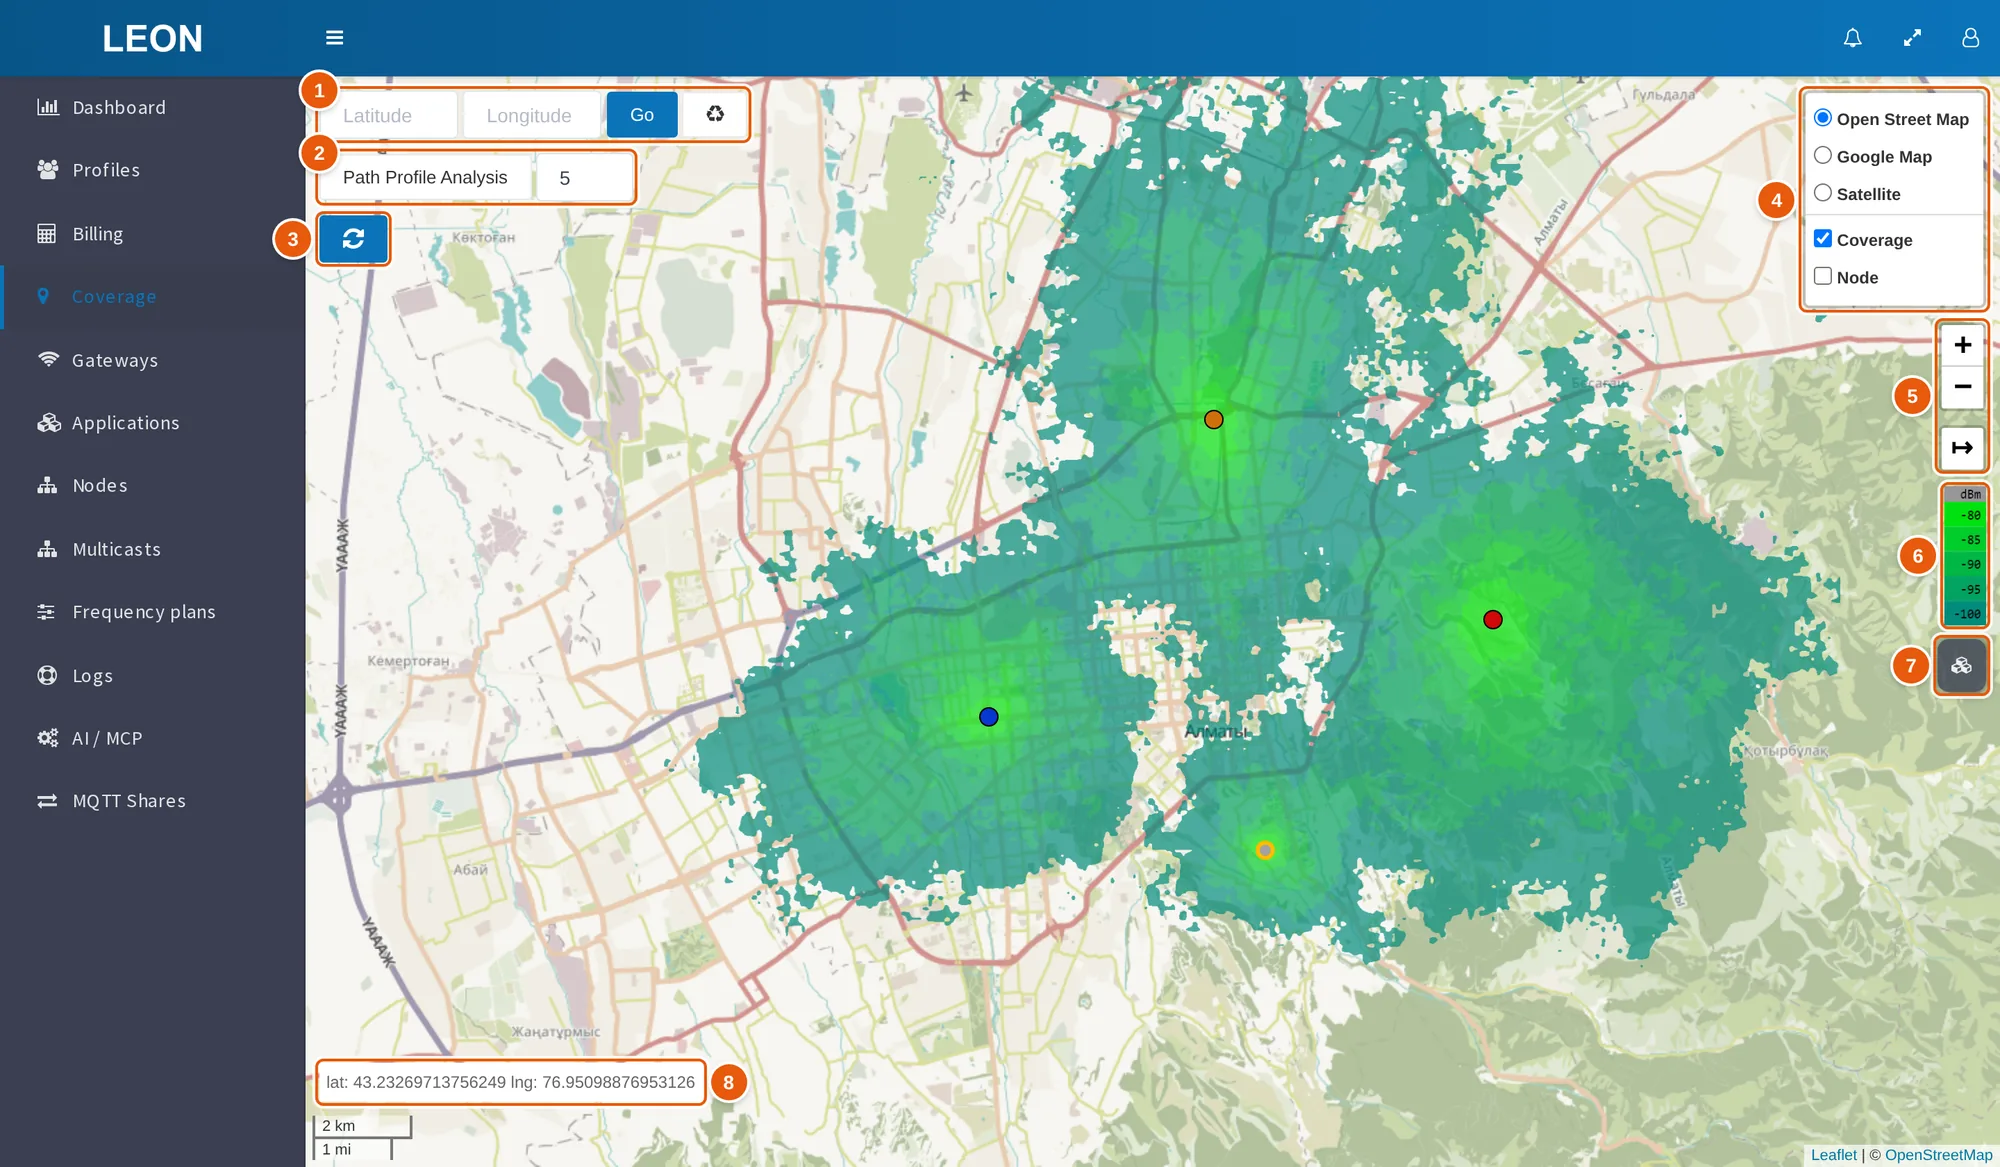
- Go-to form — the Latitude and Longitude fields, the Go button and the Clear button (recycle icon).
- Path Profile Analysis and the "Receiver height, m" field — 5 by default.
- Refresh — rebuilds the map and loads the data again.
- Layer switcher — the Open Street Map, Google Map and Satellite base layers and the Coverage and Node overlays; it expands when you hover over the layers icon.
- Zoom buttons and distance ruler.
- Legend — a dBm scale from −80 to −100 dBm.
- Cubes icon (Show nodes) — opens the device panel.
- Cursor coordinates —
lat: … lng: ….
Gateways on the map: colors, popups, clustering
Each gateway is a circle. Its color depends on when the gateway last reported:
| Color | Last reported |
|---|---|
| Blue | Less than 1 hour ago |
| Orange | 1 to 3 hours ago |
| Red | 3 hours ago or earlier |
| Gray | Never |
A gateway marked Planning only has a thick yellow border. The selected gateway has a green halo.
A click on a gateway selects it and centers the map on it. The popup shows:
- "Gateway:" and the gateway title;
- a red Planning only line, if the gateway has this mark;
- EUI;
- Altitude, m;
- Data count per hour — on this map it is the number of the gateway's data records over the last 24 hours, downlinks excluded, not per hour. The gateway property of the same name outside this map counts 1 hour;
- Description;
- Last seen — date and time in the
YYYY-MM-DD HH:mmformat; the value is highlighted light yellow if 1 to 3 hours have passed since the gateway last reported, and light red if 3 hours or more (the color is set when the gateway is loaded onto the map).
In the screenshot the Coverage overlay is turned off so that the gateway colors are easier to see.
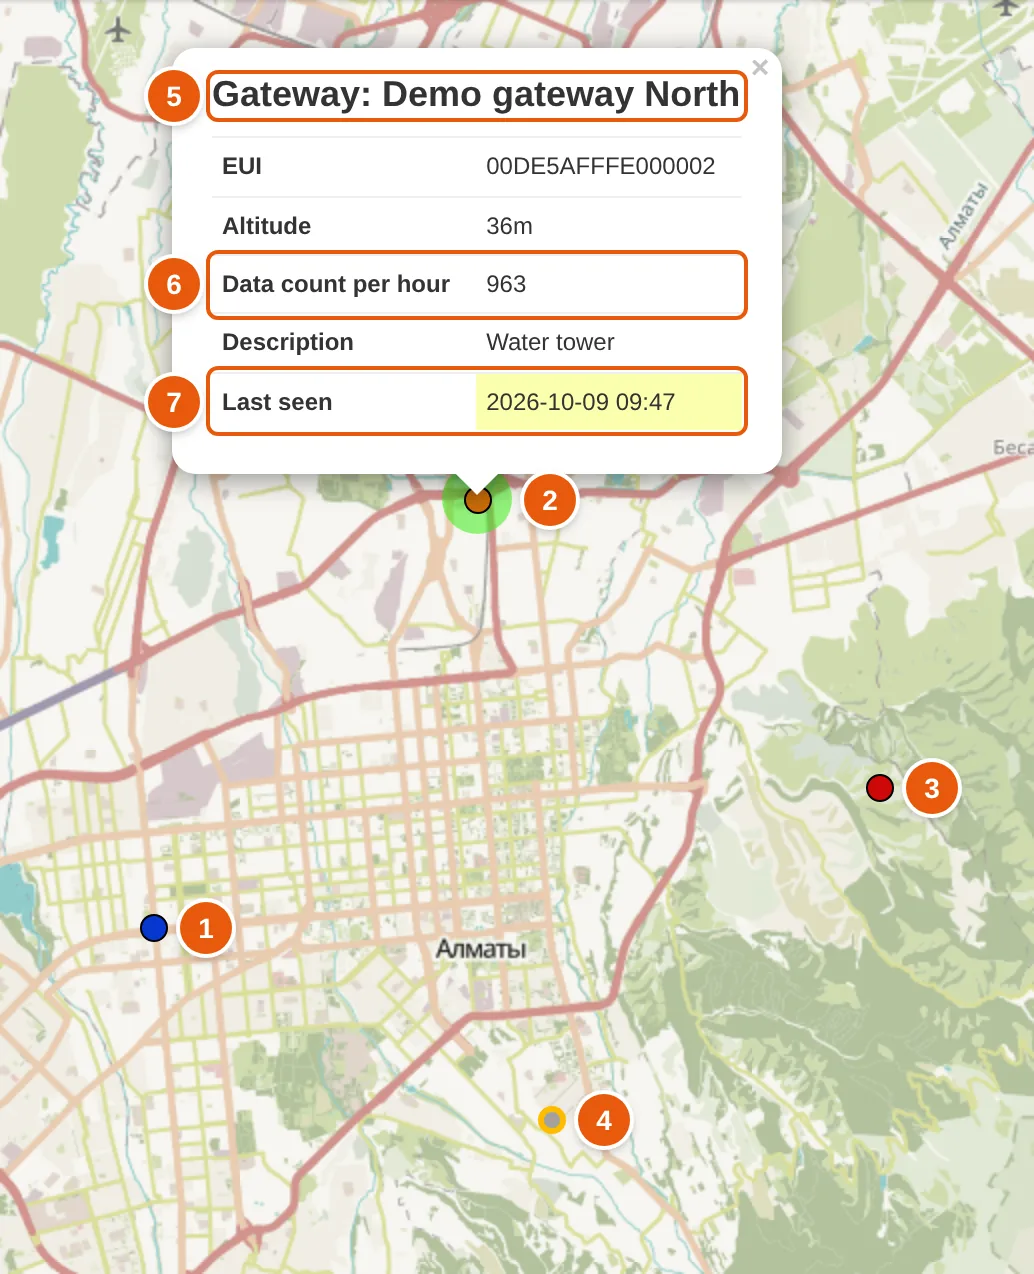
- Blue gateway — last reported less than 1 hour ago.
- Selected gateway — has a green halo. It is orange: last reported 1 to 3 hours ago.
- Red gateway — last reported 3 hours ago or earlier.
- Planning only — a gray circle (the gateway has never reported) with a thick yellow border.
- "Gateway:" and the gateway title — the popup heading.
- Data count per hour — on this map, the number of the gateway's data records over the last 24 hours.
- Last seen — highlighted light yellow: 1 to 3 hours have passed since the gateway last reported.
While the zoom is below 12, nearby gateways are grouped into clusters; from zoom 12 each gateway is shown separately. When the visible area contains at most one coverage network that has a calculated coverage image and gateways, clustering is off. Hovering over a cluster shows a summary of its gateways: Total, Active, "No connection for over an hour", "No connection for more than 3 hours", Unactive, Planning only. A gateway marked Planning only always counts in the Planning only line.
How coverage is built
Coverage is calculated by the external CloudRF service (https://api.cloudrf.com). ONS runs two kinds of calculation:
| Calculation | CloudRF request | Result | Where it is shown |
|---|---|---|---|
| Per gateway | /area | The gateway coverage image and its bounds | The image is shown on the Place map in the gateway card; the status is in the gateway list and on that map; the image is not shown on the Coverage map |
| Per coverage network | /multisite | One PNG image in the Mercator projection for the whole network, and its bounds | On the Coverage map |
The calculation takes these fields from the gateway card:
| Gateway card field | What it gives the calculation |
|---|---|
| Place | The gateway latitude and longitude |
| Altitude | The gateway altitude, m; an integer. The add-gateway form fills it with 0, and a gateway with altitude 0 is left out of the network calculation, so enter the real altitude |
| Antenna | An antenna from the antenna catalog with its CloudRF parameters. The gateway card shows the antenna radiation patterns in the horizontal and vertical planes |
| Antenna azimuth | The antenna direction in degrees from grid north; the form accepts 0–360 |
| Antenna tilt | The antenna tilt in degrees from the horizon; the form accepts −360 to 360 |
| Coverage | The coverage network whose calculation includes the gateway |
| Disabled, Indoor gateway, Planning only | Decide whether the gateway is included in the calculation — see the "Which gateways are included in the calculation" section |
The other calculation parameters are stored for each coverage network in the cloudrf_payload field (JSON) and are edited in the server administration panel with a JSON editor. In the web interface, the Add coverage window in the gateway card asks only for the title of the new network. A new network gets these defaults:
| Group | Default values |
|---|---|
| (top level) | engine: 2 |
transmitter | frq: 868, txw: 0.025, bwi: 0.125 |
receiver | alt: 2, rxg: 2, rxs: -90 |
antenna | txg: 2.15, txl: 0, ant: 1, hbw: 360, vbw: 90, fbr: 0, pol: v |
model | pm: 1, pe: 2, ked: 1, rel: 50 |
environment | clt: Minimal.clt, elevation: 2, landcover: 1, buildings: 0, obstacles: 0 |
output | units: m, col: LORA100.dBm, out: 2, nf: -120, res: 4, rad: 10 |
The table leaves out the service fields site and network and the lat, lon coordinates. For each gateway ONS puts the gateway coordinates and altitude (lat, lon, alt) into transmitter, and the antenna parameters from the catalog, the azimuth (azi) and the tilt (tlt) into antenna. The meaning and units of the parameters are those of the CloudRF API. Existing networks may have values different from the defaults.
Which gateways are included in the calculation
A gateway is left out of the coverage network calculation if it:
- is deleted;
- is disabled — the Disabled mark;
- is offline — it last reported more than 24 hours ago and is not marked Planning only;
- is indoor — the Indoor gateway mark;
- has an altitude of 0 m or less;
- has no place;
- has no antenna.
A gateway marked Planning only is never counted as offline; the other conditions apply to it as usual. If no eligible gateways are left, the network calculation is skipped: the status becomes "Coverage is ready", and the status message reads All gateways is offline, disabled or indoor. Skipe coverage creation.
The per-gateway calculation is skipped for an indoor gateway, a gateway without an antenna and a gateway without a place.
The Coverage field in the gateway card is optional. But the map does not receive a gateway without a coverage network: such a gateway is not on the map and is not part of any network calculation.
When coverage is recalculated and how to check the status
The calculation always runs as a background task on the server: the result appears once the task has finished.
| Event | What is recalculated |
|---|---|
| A gateway is saved — if it reported within the last 24 hours or is marked Planning only, and is neither deleted nor disabled | The coverage of the gateway and of its network |
| A coverage network is saved | The coverage of all eligible gateways of the network and the network image |
| The Update coverage bulk action in the gateway list | The coverage of the selected gateways and of their networks |
The Update coverage action is shown to users who are allowed to add gateways.
The calculation status is shown by a label with a globe:
- in the gateway list next to the gateway title — the status of that gateway's calculation;
- in the gateway list next to the network name in the Coverage network column — the status of the network calculation;
- in the gateway card — on the Place map, below the marker buttons.
| Code | Label | Look |
|---|---|---|
| 0 | "Coverage generating" | Yellow, with a spinner |
| 1 | "No coverage generated" | Red |
| 2 | "Coverage is ready" | Green |
"Coverage is ready" does not always mean that an image was built. Status 2 is also set when the calculation was skipped: for a gateway that is indoor, has no antenna or has no place; for a network when no eligible gateway is left in it. A CloudRF error in the network calculation gives status 1. If the service responds with an error during a per-gateway calculation, the gateway label can stay at "Coverage generating".
Path profile analysis
A path profile is a chart that CloudRF builds for the path between a gateway and a chosen point (the /path request). The transmitter is the gateway with its place, altitude, antenna, azimuth and tilt; the receiver is the chosen point at the given height.
- Click a gateway on the map to select it.
- If needed, change the receiver height in the "Receiver height, m" field — 5 by default.
- Press Path Profile Analysis; the button turns green.
- Click a point on the map, or enter its coordinates in the go-to form and press Go.
The chart appears in a popup at the chosen point, and the point itself is marked with an orange dot. The mode switches off after each analysis: for the next point, press Path Profile Analysis again. If no gateway is selected, choosing a point shows the error "First select the gateway".
The web interface gets the profile with the GET /api/v1/path_profile request:
| Parameter | Description |
|---|---|
gateway | Required. Gateway EUI, 16 hex characters |
to_lat | Required. Latitude of the point |
to_lon | Required. Longitude of the point |
rxh | Receiver height, m |
The user needs the permission to view gateways; without it the server responds 403 You do not have permission to perform this action.. The user must also have access to this gateway — the view right or ownership — otherwise 403 Not found.. A deleted or unknown gateway gives 404 Not found.. The result is a PNG image encoded in base64.
Devices on the map
Devices (called nodes in the interface) are shown on request:
- Click the cubes icon at the top right (Show nodes).
- Check the applications. The list contains the active applications available to the user (own ones and those with the view right), sorted by name; the Applications box selects them all.
- Press Show nodes.
The map requests the coordinates of the devices of the selected applications and places markers for those that have coordinates. The server returns only active devices the user is allowed to see: DevEUI, description, time of the last message, time of the last network join and coordinates.
The marker color depends on the time of the last message:
| Color | Last message | Legend label |
|---|---|---|
| Green | No more than 24 hours ago | "Active today" |
| Yellow | More than 24 but no more than 48 hours ago | "No connection more than 24 hours" |
| Orange | More than 48 hours ago | "No connection more than 48 hours" |
| Red | Never | "No connection" |
The legend under the Nodes heading shows the number of devices of each color; the label shows on hover. Only devices with coordinates are counted. The device popup shows "Node:" and the device DevEUI, Last join (the last network join) and Last message; the Last message line is colored like the marker.
Each device gets a circle with a radius of 50 m. After the first load a Settings block appears with the Radius slider (50–500 m, 50 m step) and the Transparency slider (0–1, step 0.1, 0.3 by default).
In the screenshot the Coverage overlay is turned off so that the device markers are easier to see.
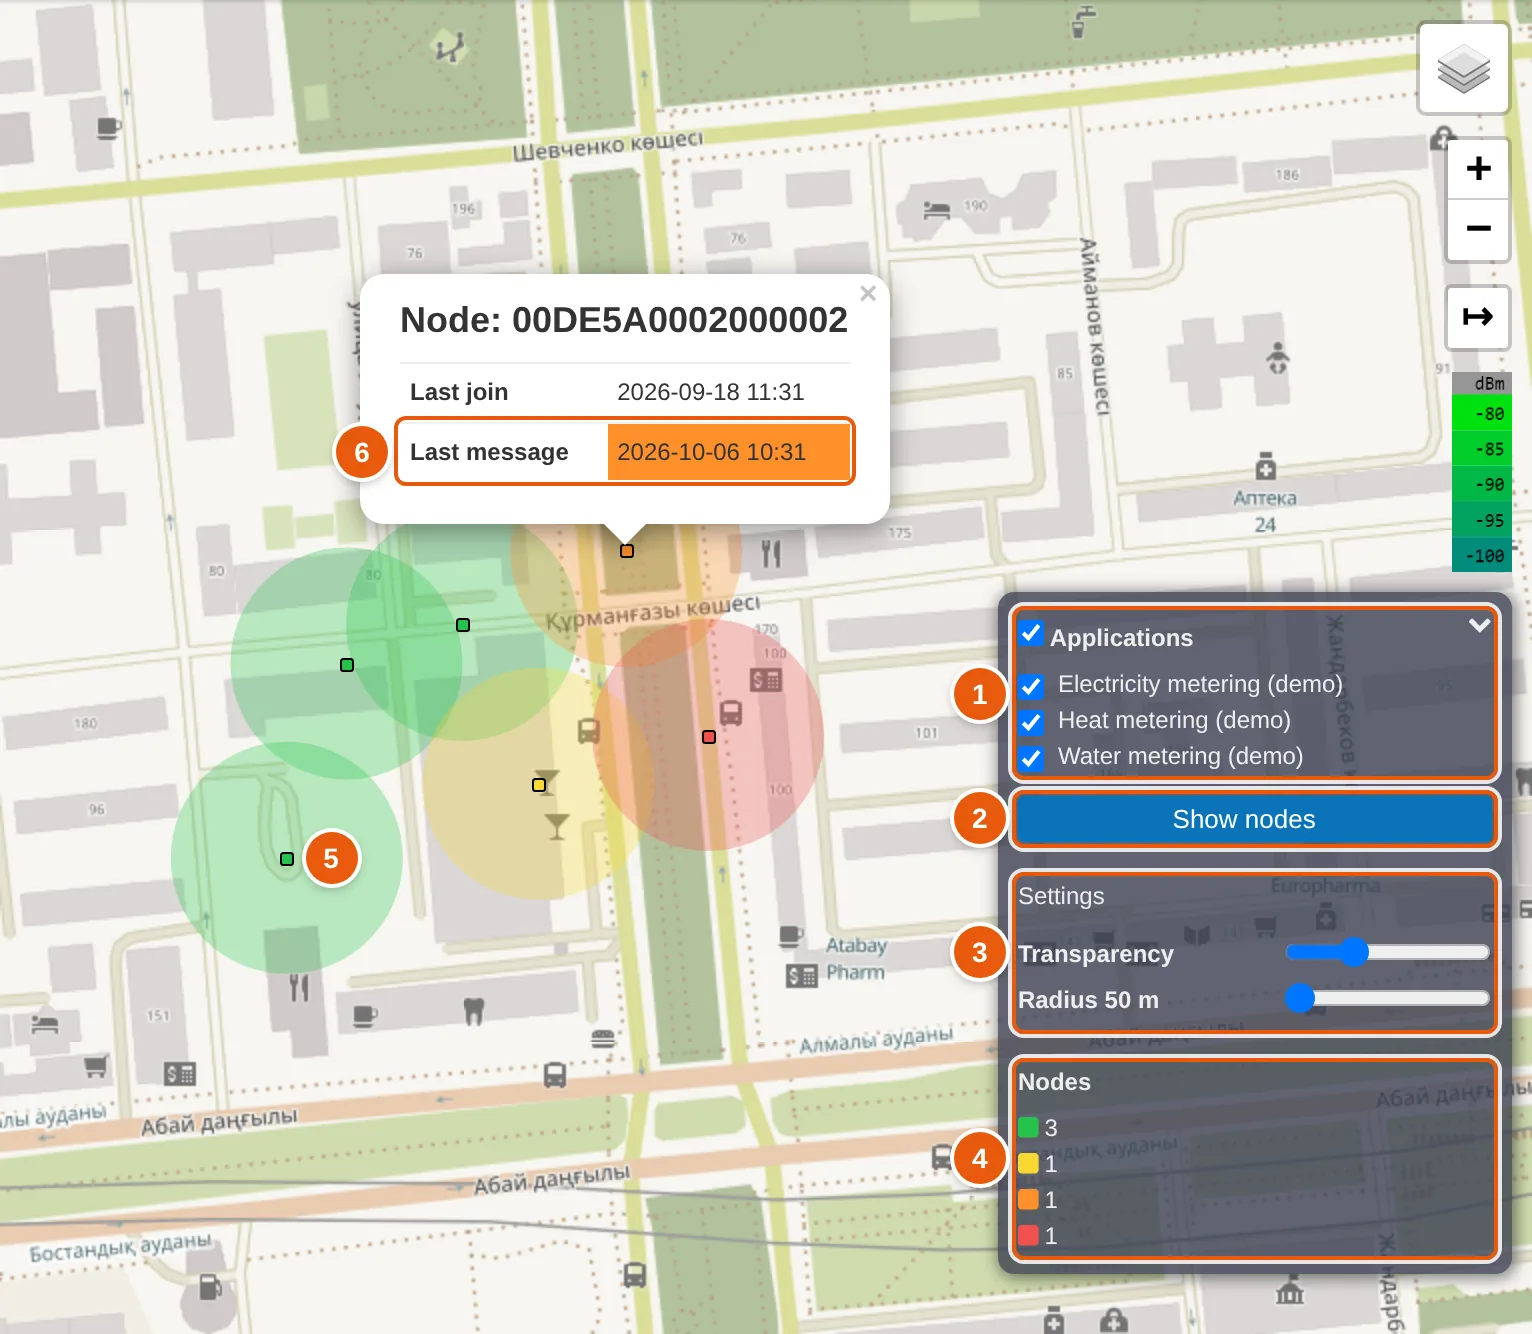
- Applications — the list of applications; the Applications box selects them all.
- Show nodes — places the markers of the devices of the checked applications on the map.
- Settings — the Transparency and Radius sliders.
- Nodes legend — the number of devices of each color: green, yellow, orange, red.
- Device marker with a 50 m circle around it. A green marker means the last message came no more than 24 hours ago.
- Last message — the line is colored like the marker; orange means the last message came more than 48 hours ago.
Each load adds devices to those already shown, with no duplicates by DevEUI. To start over, press Refresh. The panel lists at most 50 applications: it reads only the first page of the list.
Device coordinates are set with the WebSocket API command set_device_coordinates_req: the server writes them to the same device settings field the map reads them from.
Why coverage or a gateway is missing from the map
| What you see | Cause | What to do |
|---|---|---|
| A gateway is not on the map | The gateway has no coverage network | Select a network in the Coverage field of the gateway card |
| A gateway is not on the map | The gateway is disabled or deleted | Nothing: disabled and deleted gateways do not get on the map |
| A gateway is not on the map | The gateway has no Place: the map looks for gateways by their coordinates in the visible area | Set the place in the gateway card |
| A gateway is not on the map | Its network was loaded earlier, while the gateway was outside the visible area; a loaded network is not updated | Press Refresh |
| No networks and no gateways on the map | No permission to view coverage networks | Ask an administrator for the permission to view coverage networks |
| Some networks did not appear | The visible area contains more than 50 networks, and the map reads only the first 50 | Zoom in |
| Gateways are shown, the coverage image is not | The network calculation is still running, ended with an error or was skipped | Check the network status in the gateway list, Coverage network column; check the conditions in the "Which gateways are included in the calculation" section; run Update coverage |
| No network has a coverage image | The Coverage overlay is turned off in the layer switcher | Turn the Coverage overlay on |
| After changes the map shows old data | Networks already loaded are not replaced by new data | Press Refresh |
| A device is not on the map | The device has no coordinates, the device is inactive, or its application is not among the first 50 | Set the coordinates with set_device_coordinates_req |
See also
- Set device coordinates — how to store the coordinates that put a device on the map.
- Get device coordinates — how to read the stored coordinates.
- Introduction — what Orion Network Server is.