Dashboard
The dashboard is the start page of the ONS web interface. It shows how many devices report, how busy the airtime of the gateways is, whether downlink frames get through and what the signal quality is. Below is where each number comes from and at which thresholds the color changes: without this the cards are easy to misread.
Where the dashboard is and who can see it
- The dashboard address is
/dashboard. An empty address and any unknown path redirect to it. - The dashboard is the first item of the side menu: "Dashboard" in the English interface, "Панель устройств" in the Russian one.
- The dashboard is visible to a user who has at least one of the roles
staff,adminormonitoring. Roles are the names of the user's groups on the server; in addition, a superuser gets thesuperuserrole and a user with the staff flag gets thestaffrole. - Without a suitable role the menu item is hidden, and opening the address takes the user to the login page
/login.
The blocks go from top to bottom in this order:
| Block | What it shows | Visible to |
|---|---|---|
| Nodes activity | How many devices reported within the last 24, 48 and 72 hours | Everyone who can see the dashboard |
| Network Health | Gateway airtime load, downlink delivery, traffic by operator | Everyone who can see the dashboard |
| Queues | Internal server queues: the number of messages and consumers | Superuser only |
| Network State | Signal and traffic charts for the selected dates | Everyone who can see the dashboard |
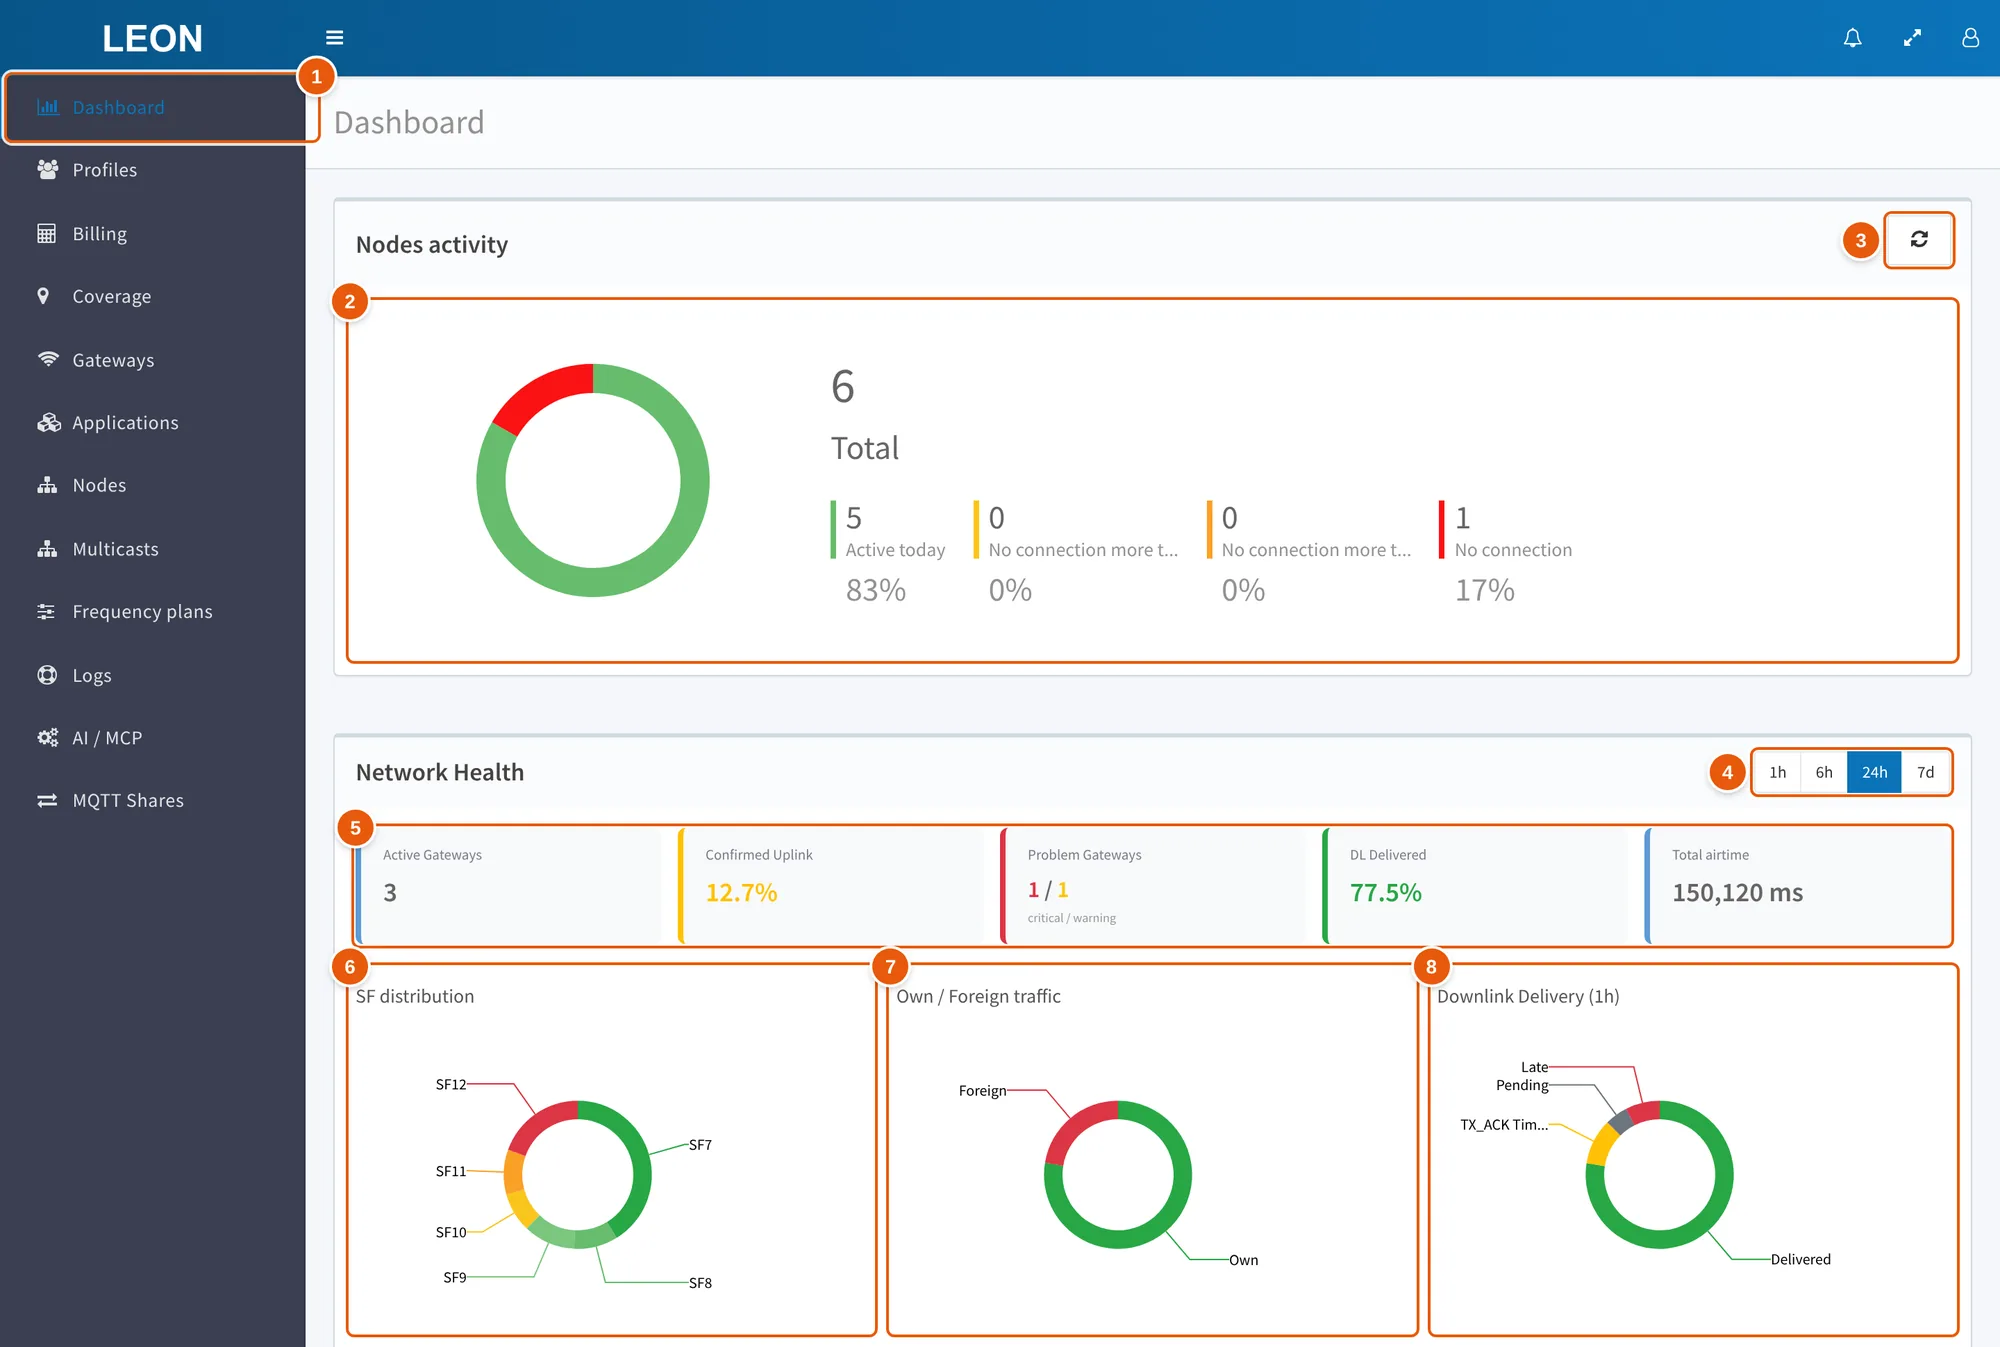
- Dashboard — the side menu item that opens the dashboard
/dashboard. - Nodes activity — the pie chart: Total and the four device groups by the time of the last packet.
- Refresh button — requests the Nodes activity data again.
- 1h, 6h, 24h, 7d — the Network Health period; the default is 24h.
- Cards — Active Gateways, Confirmed Uplink, Problem Gateways, DL Delivered, Total airtime.
- SF distribution — the shares of uplink airtime at SF7…SF12.
- Own / Foreign traffic — the airtime of own and foreign devices; the segments are labeled Own and Foreign.
- Downlink Delivery (1h) — downlink frames by status for the selected period.
Nodes activity
A pie chart with the total number of devices (Total) and a refresh button. Devices fall into four groups by the time of their last packet:
| Group | Last packet | Color |
|---|---|---|
| Active today | Less than 24 hours ago | Green |
| No connection more than 24 hours | 24 to 48 hours ago | Yellow |
| No connection more than 48 hours | 48 to 72 hours ago | Orange |
| No connection | More than 72 hours ago or never | Red |
Only active devices (the active flag) are counted; multicast groups are excluded. A user sees the devices they have view permission for and the devices of their own applications. A superuser sees all active devices.
Network health: period and data sources
The period is set with the 1h, 6h, 24h and 7d buttons; the default is 24h. The selected period applies to the whole block: cards, charts and tables. The server does not count more than 168 hours (7 days): it cuts a larger value down to 168.
Where the data comes from:
- Gateway airtime — the cards except DL Delivered, the SF distribution and Own / Foreign traffic charts, the problem gateways table. The source is hourly airtime counters for each gateway, kept for 8 days.
- Traffic by operator — a similar hourly counter for each gateway, but it accumulates the number of uplink frames, not airtime.
- Downlink delivery — the DL Delivered card and the Downlink Delivery (1h) chart. The source is the downlink frames of the selected period stored by the server.
The counter step is one hour: the window includes the hours that start no earlier than "now minus the selected period". So with the 1h period the calculation usually includes only the current, unfinished hour.
The whole block counts only active gateways for which the user has view permission (view_gateway) on that specific gateway. For a superuser the calculation includes all active gateways.
Cards
| Card | What it shows | Color |
|---|---|---|
| Active Gateways | The number of gateways available to the user through which at least one uplink passed during the period. A gateway with no uplink during the period is not counted, even if it is online | — |
| Confirmed Uplink | The share of confirmed uplink airtime (Confirmed Data Up, MType 4) in the whole uplink airtime of the available gateways, % | Above 15% — red, above 5% — yellow, otherwise green |
| Problem Gateways | The number of critical gateways and the number of warnings separated by "/" among the first 20 problem gateways — the ones in the table; if only one kind of problem is present, a single number without "/". See Problem gateways | Critical in red, warnings in yellow; with no problems — a green 0 |
| DL Delivered | The share of downlink frames with status 3 (Delivered) among all frames of the period, % | Above 75% — green, above 50% — yellow, otherwise red |
| Total airtime | Total uplink airtime of the available gateways for the period, ms | — |
Charts
SF distribution
The SF distribution doughnut chart: the shares of uplink airtime at SF7…SF12 across all available gateways, in percent. The SF is derived from the frame data rate (DATR); SF7BW250 also counts as SF7.
Own and foreign traffic
The Own / Foreign traffic chart splits the airtime into own and foreign:
- Own is an uplink data frame whose DevAddr is in the server memory at the moment of reception. Everything else counts as foreign, including frames without a DevAddr, such as Join Request.
- The server memory also holds foreign DevAddr values: while the server looks the device up in the database and for 5 more minutes after it has not found it. So frames of a foreign device that reports more often than once every 5 minutes can be counted as own, and then the share of foreign airtime is too low — on this chart and in the Foreign % column of the problem gateways table.
- The chart is calculated in the browser and only over the 20 gateways with the highest share of confirmed airtime, not over the whole network.
- The airtime of each gateway is split by its share of foreign traffic (Foreign %); the unit is milliseconds of airtime.
- The segments are labeled Own and Foreign in both languages.
Downlink delivery
The Downlink Delivery (1h) chart and the DL Delivered card are built from the downlink frames of the selected period that went through gateways available to the user. There are four segments; segments with a zero value are hidden.
| Segment | Frame status | Meaning |
|---|---|---|
| Delivered | 3 | The gateway responded with a TX_ACK without an error, that is, it accepted the frame for transmission. The device does not acknowledge reception |
| TX_ACK Timeout | 7 | The gateway did not acknowledge the transmission within 10 seconds |
| Pending | 1 (Sent) | The frame has been handed to the gateway; no acknowledgement yet |
| Late | 2 | The gateway responded with the TOO_LATE error or with an error of unknown code |
The delivery percentage is Delivered divided by all frames with any status. So frames with statuses that are not on the chart, such as Too Early and Collision, also lower the percentage. All statuses are described on the Sending data to a device page.
Traffic by operator (NwkID)
The Traffic by operator (NwkID) table shows whose devices occupy the airtime of your gateways. It counts uplink data frames, not airtime. Frames are grouped by NwkID — the upper 7 bits of DevAddr. The operator name comes from the NetID Type 0 registry: for example, 0x13 is The Things Network, 0x21 is Orion M2M. The first 15 operators by frame count are shown.
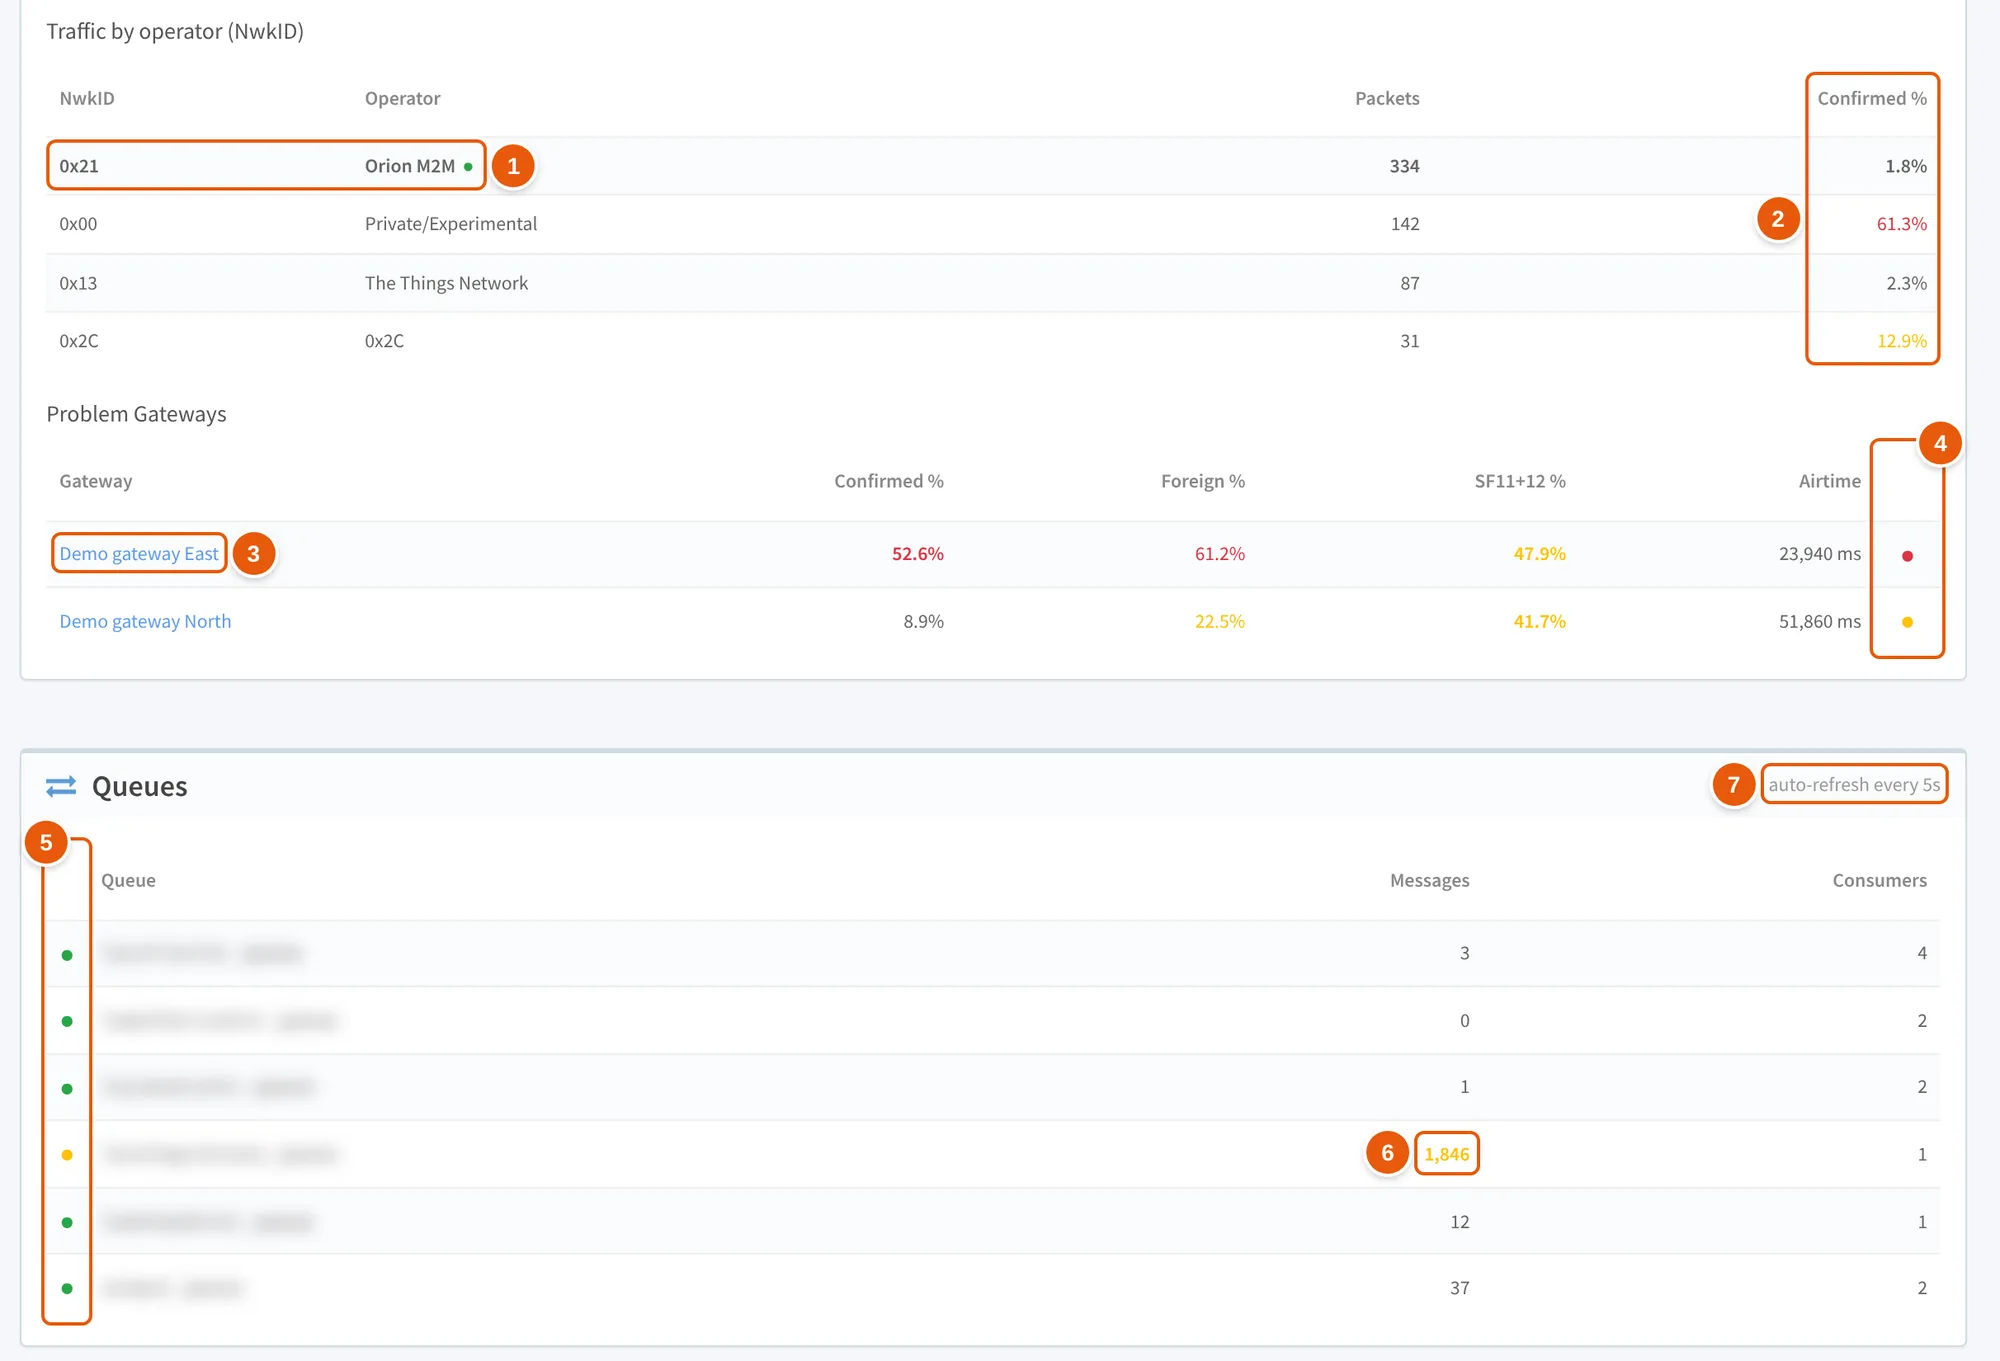
- Own network row — NwkID 0x21, bold and marked with a green dot.
- Confirmed % — the operator's share of confirmed frames: above 50 — red, above 10 — yellow.
- Gateway — the problem gateway title; the link leads to the gateway page.
- Dot — problem level: red — critical, yellow — warning.
- Indicator — the queue dot: green, yellow, red or gray.
- Messages — the number of messages in the queue: one of the queues has more than 1000, so its dot is yellow.
- auto-refresh every 5s — the Queues panel refreshes every 5 seconds.
| Column | What it shows |
|---|---|
| NwkID | The network identifier in hex |
| Operator | The operator name from the registry; if the NwkID is not in the registry — the NwkID itself in hex. The row of your own network (NwkID 0x21) is bold and marked with a green dot |
| Packets | The number of uplink data frames for the period |
| Confirmed % | The share of confirmed frames: above 50 — red, above 10 — yellow |
Problem gateways
A gateway is a problem gateway if its share of confirmed airtime is above 15% or its share of SF11 and SF12 airtime is above 30%. A problem gateway is critical if confirmed is above 50% or SF11+SF12 is above 60%; the other problem gateways are warnings.
The Problem Gateways table shows at most 20 rows sorted by Confirmed % in descending order. If there are no problem gateways, a green bar "No congestion problems detected" is shown instead of the table.
| Column | What it shows | Cell color |
|---|---|---|
| Gateway | The gateway title; if it is not set — the description, and if there is no description either — the EUI. The link leads to the gateway page /gateways/<EUI> | — |
| Confirmed % | The share of the gateway's confirmed airtime | Above 50 — red, above 25 — yellow |
| Foreign % | The share of foreign airtime | Above 50 — red, above 20 — yellow |
| SF11+12 % | The share of airtime at SF11 and SF12 | Above 60 — red, above 40 — yellow |
| Airtime | The gateway's uplink airtime for the period, ms | — |
| Dot | Problem level | Red — critical, yellow — warning |
Queues
The Queues panel is visible to a superuser only: the interface hides it from other users, and the server answers its request only for a superuser. The panel refreshes every 5 seconds and shows the internal server queues: the number of messages and consumers.
The columns are an indicator, Queue, Messages and Consumers.
| Indicator | When |
|---|---|
| Green dot | 1000 messages in the queue or fewer |
| Yellow dot (warning) | 1001 to 10,000 messages |
| Red dot (critical) | More than 10,000 messages |
| Gray dot and "— err —" instead of the number | The queue data could not be fetched; the error text is in the tooltip |
A value of 0 in the Consumers column is shown in red.
Network state
The Network State block builds charts for a date range:
- The default range is from the date one week ago through today inclusive. Hovering over the date field shows the hint "Time is in UTC"; next to the field there is a button that refreshes all charts.
- In the calendar the end of the range can be at most 30 days after the start. The server rejects a range of 32 days or more with the error "Date period must be no more than one month".
- The end date is included in full.
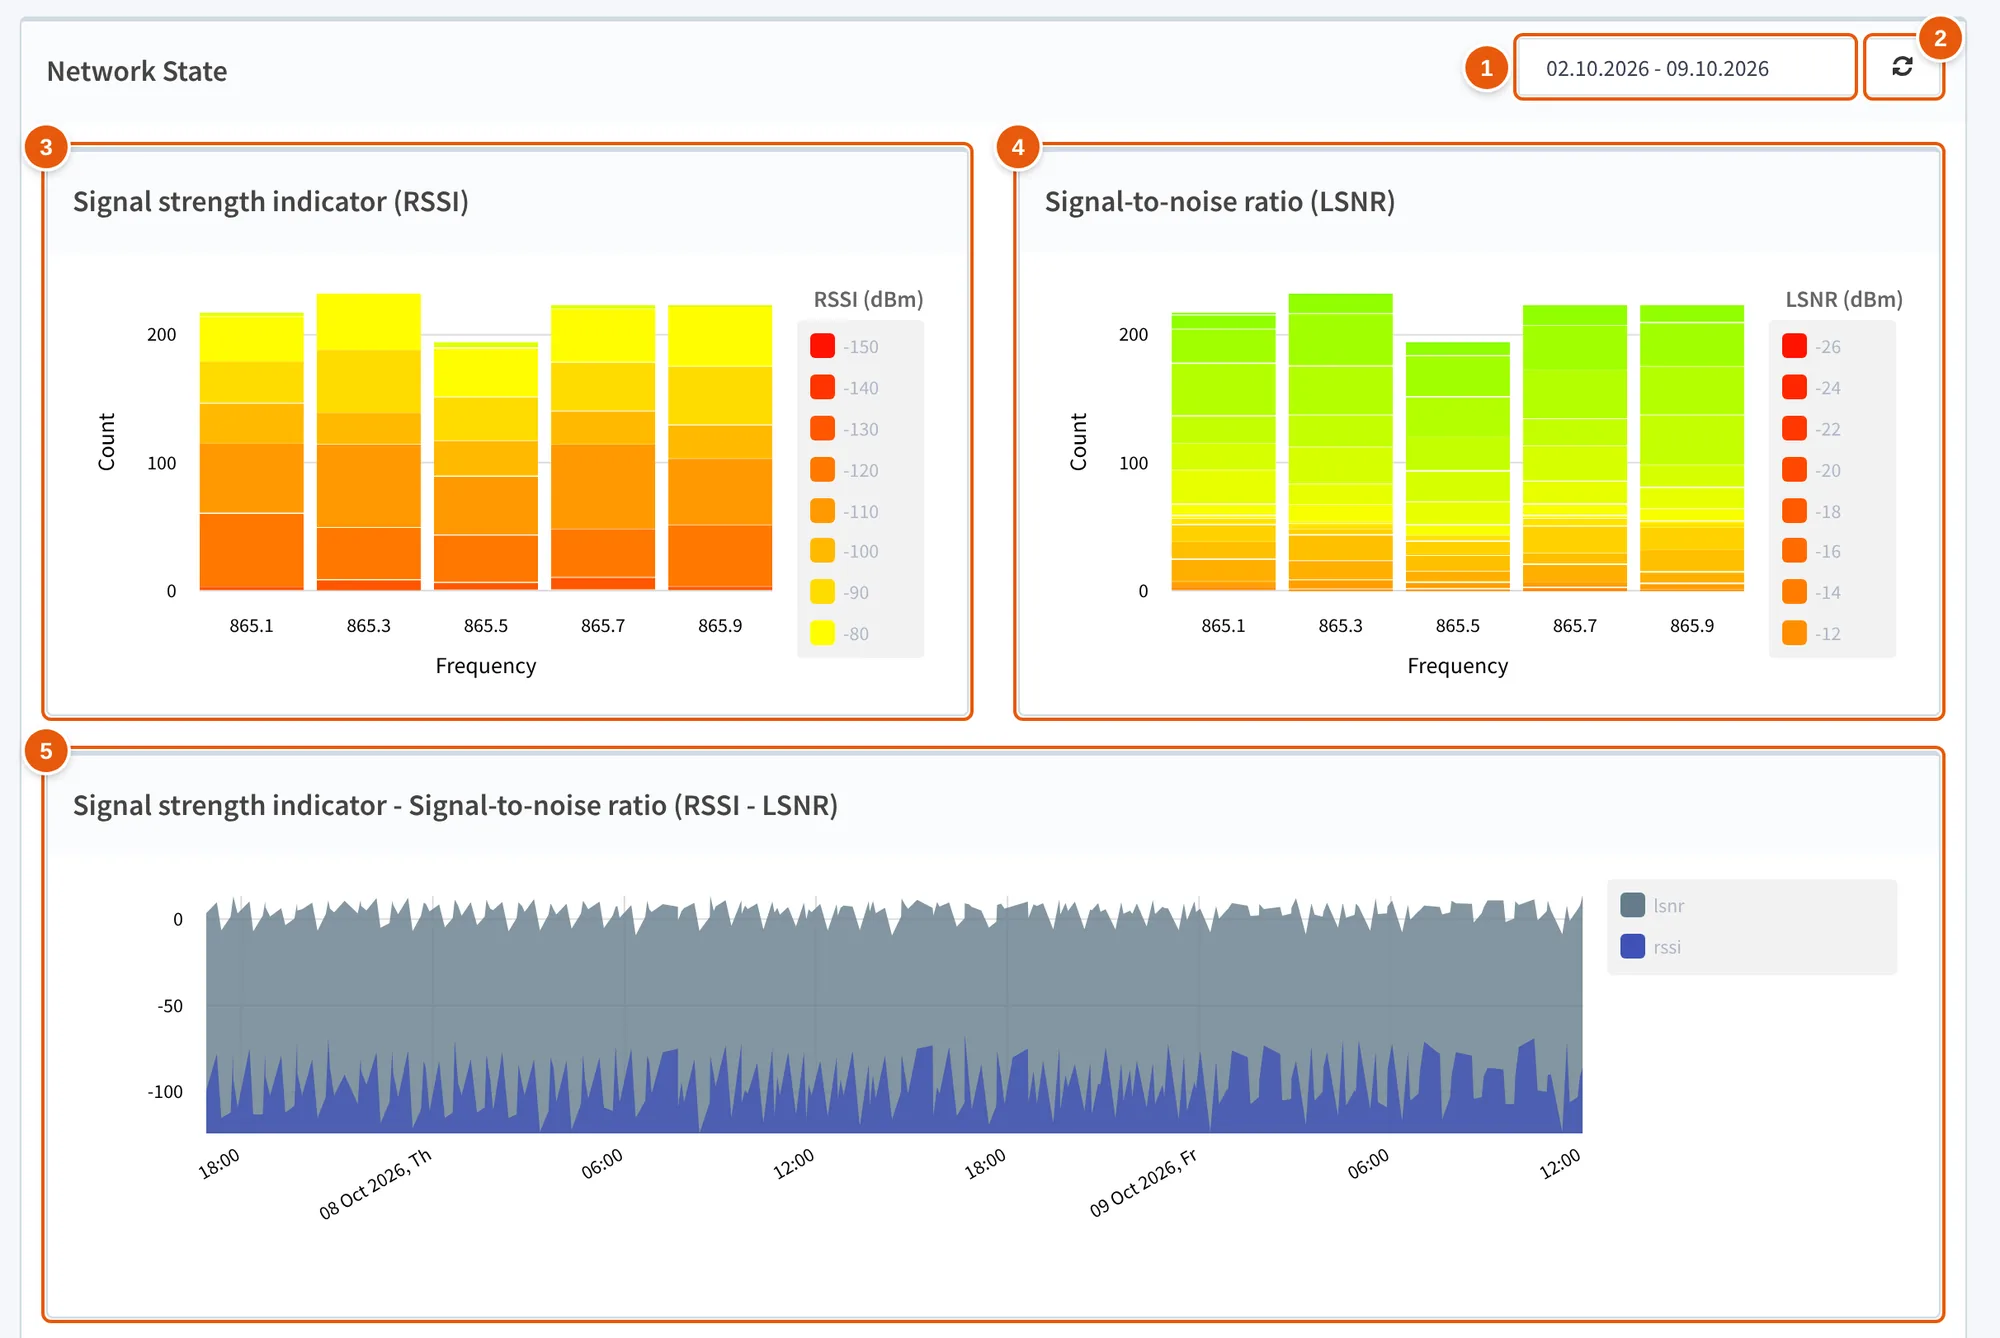
- Date field — the chart range, by default from the date one week ago through today; the hint is "Time is in UTC".
- Refresh button — refreshes all charts.
- Signal strength indicator (RSSI) — histogram: the X axis is the reception frequencies, inside a bar — the number of frames per RSSI range.
- Signal-to-noise ratio (LSNR) — histogram: the same for LSNR.
- Signal strength indicator - Signal-to-noise ratio (RSSI - LSNR) — RSSI and LSNR over time.
The charts include only uplink data frames (Unconfirmed and Confirmed Data Up) with a recorded reception frequency from active devices; Join and downlink frames are excluded. A superuser sees all data. Other users see the frames received by the gateways available to them (the view_gateway permission) and the frames of the devices of their own applications.
| Chart | What it shows |
|---|---|
| Signal strength indicator (RSSI), histogram | The X axis is the reception frequencies; inside a bar — the number of frames per RSSI range in steps of 10 dB, from −150 to −10 dBm |
| Signal-to-noise ratio (LSNR), histogram | The same for LSNR: ranges in steps of 2 dB, from −26 to +26 dB |
| Signal strength indicator - Signal-to-noise ratio (RSSI - LSNR) | RSSI and LSNR over time |
| Signal strength indicator (RSSI), bubble | RSSI of each frame |
| Signal-to-noise ratio (LSNR), bubble | LSNR of each frame |
| Spreading factor, bubble | The frame SF derived from DR: DR0 — SF12, DR1 — SF11, DR2 — SF10, DR3 — SF9, DR4 — SF8, DR5 and DR6 — SF7. The axis is labeled DATR |
| Frequency of reception | A doughnut chart: how many frames were received on each frequency |
| Packet loss rate, bubble | The packet loss rate (packet_loss_rate) of each frame |
| Traffic history | A line chart of the number of uplink data frames; the Daily (default) and Hourly buttons |
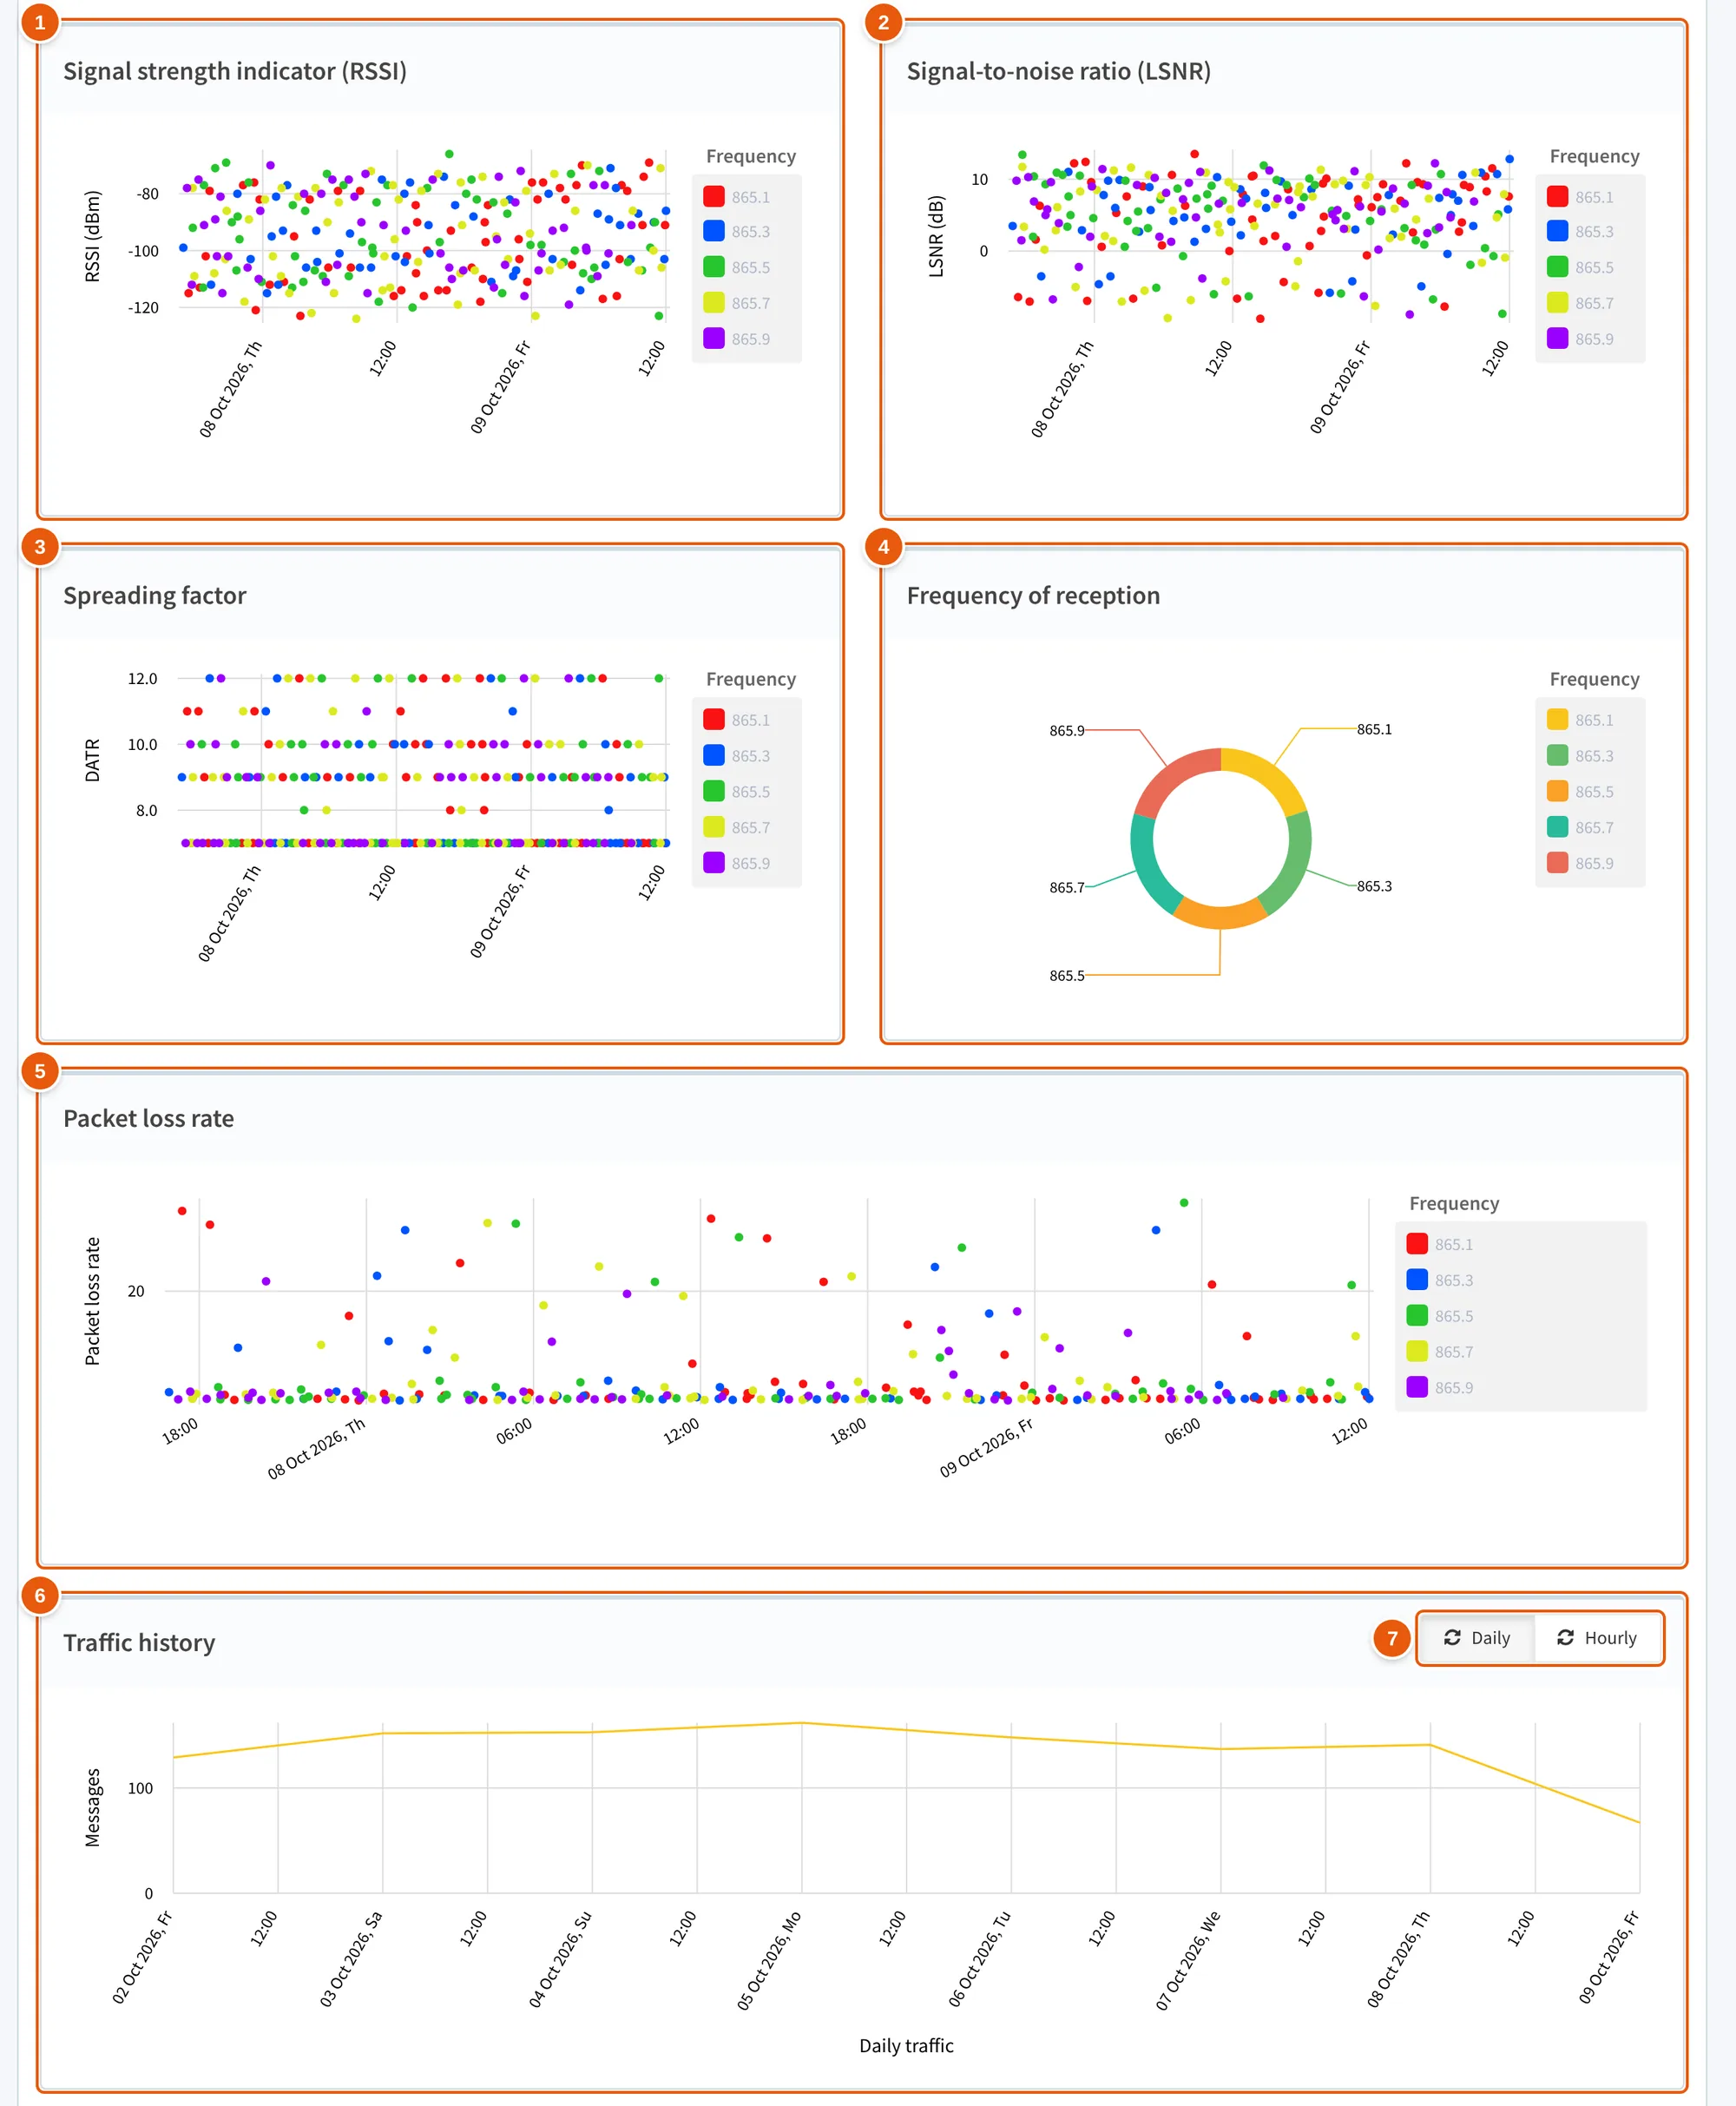
- Signal strength indicator (RSSI) — bubble chart: RSSI of each frame, series by frequency.
- Signal-to-noise ratio (LSNR) — bubble chart: LSNR of each frame.
- Spreading factor — the frame SF derived from DR; the axis is labeled DATR.
- Frequency of reception — how many frames were received on each frequency.
- Packet loss rate — the packet loss rate of each frame.
- Traffic history — the number of uplink data frames.
- Daily and Hourly — the Traffic history step; Daily by default.
The bubble charts and the RSSI - LSNR chart take only the last 250 frames of the selected range. On the bubble charts the series are split by frequency, and RSSI and LSNR are the best values among the gateways that received the frame. The RSSI - LSNR chart has two series, rssi and lsnr, with the values from the frame record.
The RSSI and LSNR histograms, Frequency of reception and Traffic history load only when they come into view, that is, as the page is scrolled. The RSSI - LSNR chart and the bubble charts load with a single request as soon as the dashboard opens. If there is no data, "No data" is shown instead of the chart.
Good to know
- Active Gateways is not the number of online gateways but the number of gateways available to you through which an uplink passed during the period.
- Network Health takes into account only permissions on specific gateways. A permission to view all gateways granted globally does not apply here; a superuser sees all active gateways.
- Airtime and frame counters are kept for each gateway separately, and the cards and tables add them up over gateways. A frame received by several gateways is counted for each of them.
- The Downlink Delivery (1h) label says "(1h)", but the chart is built for the period selected with the block buttons: this is a mismatch in the interface.
- Delivered means the gateway accepted the frame for transmission. This status does not show whether the device received it.
- Own / Foreign traffic is calculated only over the 20 gateways with the highest share of confirmed airtime, not over the whole network.
- With the 1h period everything calculated from the hourly counters (the cards except DL Delivered, the SF distribution and Own / Foreign traffic charts, both tables) usually shows only the current unfinished hour; DL Delivered and Downlink Delivery (1h) cover exactly the last 60 minutes.
See also
- Sending data to a device — downlink frame statuses and what to do if a frame was not delivered.
- Get downlink frame history — downlink frames for a period together with their statuses.
- Terms and definitions — what DevAddr and NwkID are.
- Frequency plans — uplink and downlink frequencies for each plan.